

Tables are a great way to display data. At Chartmat we have enhanced tables with additional features which go beyond what normal spreadsheets offer you.
To build a table simply add as many axis as the columns you want to display.
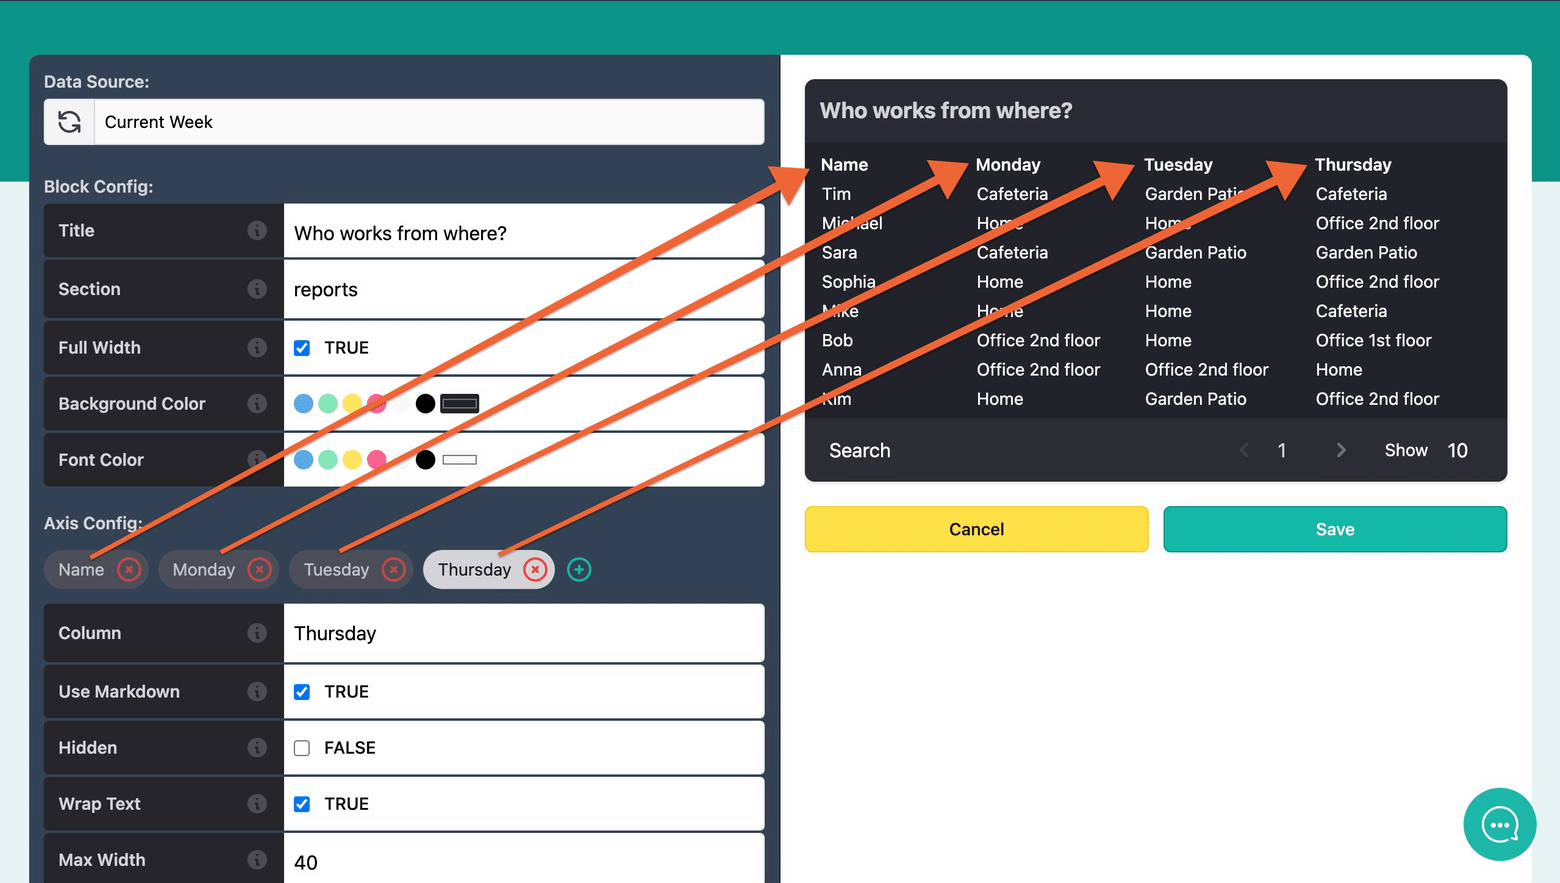
each axis represents a column
For each column you can select the maximum width and other options. You can also parse the content as markdown which will make your links clickable and add text formatting options.
Hiding columns
Often you want to have the data from specific columns but you don't want to show it all the time. If you have for example a user id, you might need it in specific occasions but most of the times you wont. This is a typical situation where hiding the column might make sense. Select the correct column (axis) which you want to hide and check the hidden box in the settings.
Now the column doesn't show up, however if you click on the row a right panel will appear which will contain all your axis including the hidden ones!
This is a great way to minimize the amount of data if you use Chartmat on mobile devices
Sort, search & filter
You can click any table header to sort by it. You have a search window at the bottom left of the block and some pagination options on the bottom right.