

Chartmat uses Google Sheets as a source of data. By default it will be able to read data from any connected spreadsheet. However, you might need to make a few edits in particular cases.
The default setup:
By default Chartmat reads data as tables. It interprets the first row as the headers of your data. So if you have a a spreadsheet as shown in the example below
| A | B | C | |
|---|---|---|---|
| 1 | Name | Price | Day |
| 2 | Pasta | $ 20 | Monday |
| 3 | Pizza | $ 30 | Tuesday |
you will be able to build charts, tables and forms directly without editing any settings. This is because by default Chartmat uses the range starting from A1 (the first row and the first column)
The non default setup:
The default setup works in most cases. However, you don't always have your table starting in cell A1. You may use a pivot table or have some explainer text above your table in which case you need to adjust the settings. Chartmat makes it super easy to set the correct range. The only thing you need to remember is that the first row always contains the headers
To change the default range to a custom value head to the board settings (from the top right "board" menu) and there you can setup a different range for each sheet.
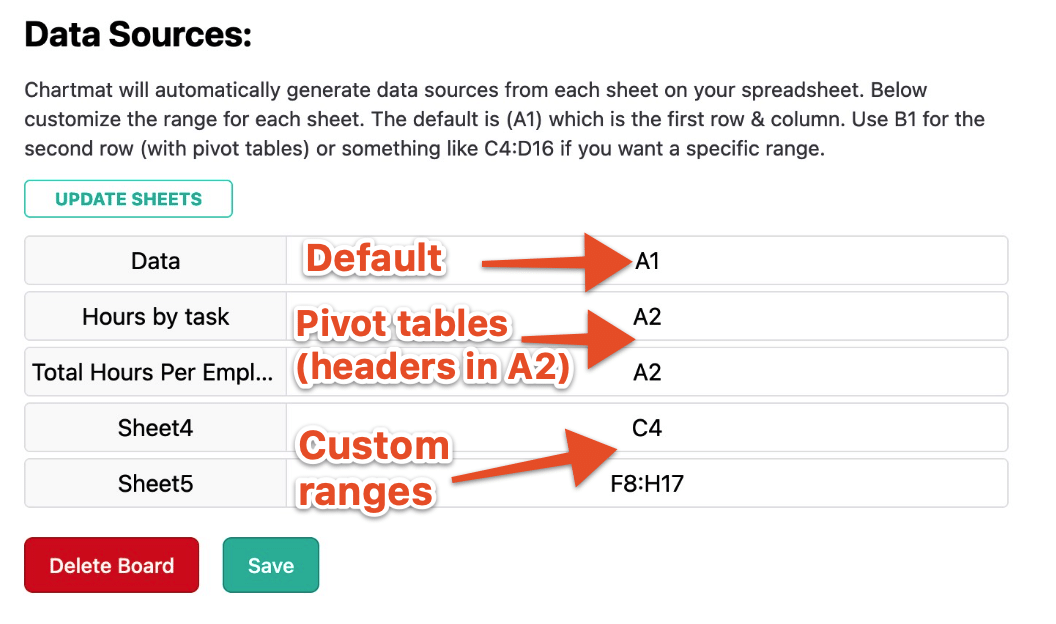
For Pivot tables use A2 (since the headers are on row 2 instead of row 1). However, you can also use specific ranges like A5:D10 if you are not planning to add further data to your table.