There are situations in which you might want to combine data from various Spreadsheets into one Single Chartmat Dashboard. The suggested way to implement this is by creating one Master Spreadsheet in which you aggregate all the data from individual Spreadsheets. In the following we walk you through the necessary steps:
1. In your Google Drive Account that is connected with Chartmat create your Master Spreadsheet.
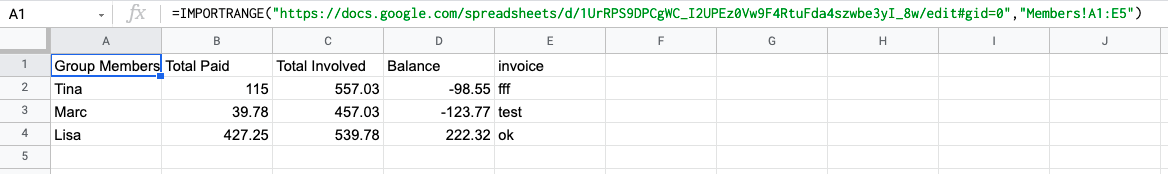
2. Next you will need to import the data from the Spreadsheets that you want to display in your Chartmat Board into the Master Spreadsheet. We recommend using a separate sheet for every data that you import from a distinct Spreadsheet:

The import can be done in Google Sheets through the IMPORTRANGE("INSERT_SHEET_URL","INSERT_RANGE") formula. If you import your data directly into the A1 cell Chartmat will be able to read and access your data without further necessities. Otherwise you can update your data source in the Board Settings. A more detailed guide how to import data into your spreadsheet is accessible on the Google Support Documentation.
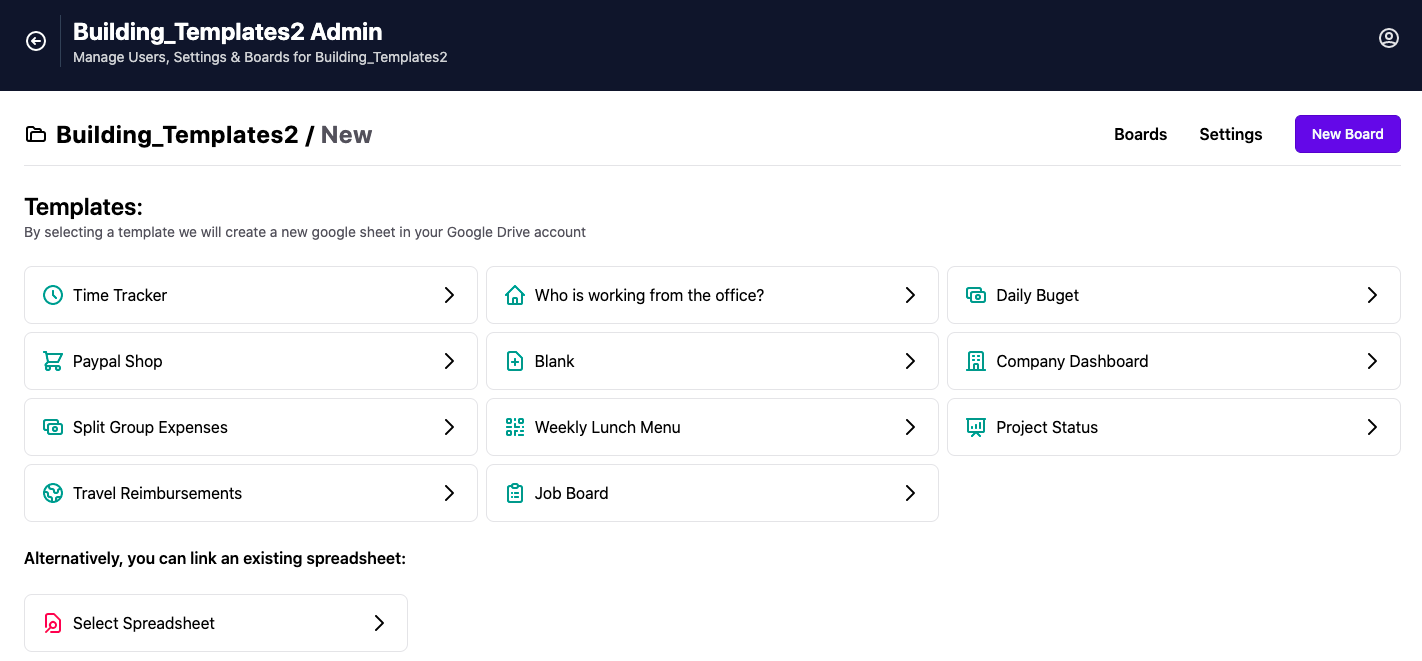
3. Now that you have all the relevant data in the Master Spreadsheet you can build a new Board on Chartmat and link it to your existing Master Spreadsheet:
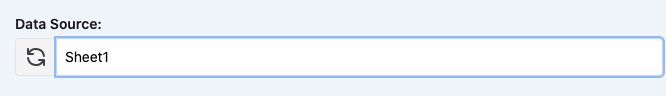
4. For every block that you add on Chartmat you can now select the data source through the drop down menu. Select different sheets for your block elements and combine data from various Spreadsheets in one single Chartmat Dashboard.